Get free samples written by our Top-Notch subject experts for taking online Assignment Help services.
The usage and development of systems that can easily learn or integrate user information without maintaining direct instruction, the Machine learning technology is a set of artificial intelligence and it focuses upon the statistical data and techniques to generate the intelligent system. Hotel and hospitality businesses have a wide range of impacts upon ML technology. Every day millions of data will be created when customers visit the hotel website and browse the site for them. ML algorithms will be helpful in such cases to develop an intelligent computer system that can easily handle those huge amounts of data and store them accordingly. ML techniques enhance the performance and efficiency of the annual revenue management system that gradually increases the business.
Utilization
ML techniques with its implementation over the consulting services can estimate the accuracy and hotel revenue from a target data. Historical data from both successful and unsuccessful condition under those certain criteria can be estimated using classification or regression of ML algorithms. The learning procedures using these machine learning techniques can improve the future work. Both classification and regression technique will be applied to identify the possible features such as location, popularity and density from a set of information. This process can further improve the hotel revenue along with their performance.
Deployment of different ML models
Proper personalization, "real-time data managing" and automation will be possible using these intelligent systems, where it allows the outperforming of the total system, to fulfill the customer demand by making a satisfactory service and increasing the revenue. Using different machine learning techniques the hotel performance will be further increased, however, the geographical and socio-economic data has been used in this report to analyze the deployment of these ML techniques. The execution has been described with various ML techniques such as
These machine-learning techniques can increase the performance or efficiency of that hotel while these ML models provide the intelligent models to serve the customers with a better service and increase the annual revenue. A classifier utilizes the training data to learn about the input variables that occur from that class however these classifiers work as a "Supervised ML" techniques. The classifiers continuously convert the stored data into train and test data to determine the accuracy of those classes.
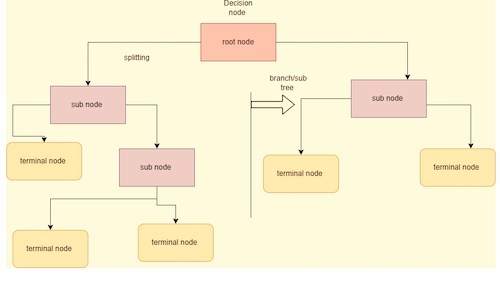
The above image shows the process of classification where the root nodes are divided into other nodes and the terminal nodes. Using the splitting procedure, the classifier algorithms describe the accuracy of an original dataset. Classification occurs with various ML algorithms such as
Classification using ML will develop the probabilistic approach and provide the statistical significance of that hotel features. The report analyzes the linear, random forest and “support virtual machine” to generate the accuracy of that predicted train and test data.
Regression in ML techniques occurs with the mathematical modeling that predicts the continuous output based on the predictable variables, the continuous value prediction will increase the customer relationship with that hotel, where the service economical development will be further increased by these supervised techniques. Regression predicts the target variables and is represented along the two axes to provide the relationship between the input and output variables. The report analyzes the geographical and economical data to predict the target column and represents the relationship accordingly. Regression with ML techniques uses the supervised learning methods where the categorical data of the hotel will be mapped using different functions to get the best predictions about their performances. These learning methods are easier to implement, per formative, interpret and deliver the efficient accuracy of that train data. ML techniques improve the statistical process in substantive ways and provide a better guest experience while increasing the hotel business such as revenue, marketing, and pricing. The right ML techniques, adding more data, treating missing or null data and feature extension of that hotel target variable will further increase the performance of train data.
Company objectives can be easily drawn after applying those observed ML algorithms. Observed values with a target column can be predicted as required from the set of information. The data belongs to classification or regression can predict accuracy from those selected dataset.
The performance metrics has been used to predict the hotel revenue and performance by applying ML algorithms over the dataset. Productivity, profit margin, geographical location and business goals can be easily measured to increase the revenue as required.
Machine learning technology is a trending approach in this present era. Today this trending approach helps to build a model best structure based on a simple data set to make decisions or predictions without being explicitly programmed (coursera.org, 2022). Data mining is also an important step in this machine learning activity. In this report, data mining will be done based on a defined data set. The data set contains the entire hotel's related information. This data mining will help to develop a list of hotels that give better facilities and all. In this report, the data analysis will be done on two types of data set that are geographical and socio-economical. The classification, regression, clustering, and rule mining techniques are used here to complete this entire analysis process.
Data mining is a mostly used process in this present situation. The data analysis process helps to analyze data from a large data set (coursera.org, 2022). The data analysis process is done by identifying and collecting the data from a large dataset. After that, the cleaning process is done. After cleaning of data analysis part takes place then interpretation has been done. This data analysis process contains some better techniques that can give a better error detection process (Feldman et al, 2019).
Machine learning is a trending approach that is used in the data analysis process also. This machine learning approach is one of the best approaches in this digitalization era (Ray 2019). Machine learning is a process that includes several algorithms and statistical models that are used when a computer system is performing (Khanzode and Sarode 2020). The machine learning process is used two techniques that are supervised learning and unsupervised learning (coursera.org, 2022).
The main focus of this report is to analyze two data sets. These data sets contain all information on the hotel system. Here this entire analysis process has been done on a platform that is a jupyter notebook with the help of python language. In the beginning, the p2 data set analysis process is done on this platform by using python language. At first, some library functions and packages are imported to get access to the methods and class. After that data set has been imported by read comments. After that null value checking process has been done by using some null value checking a comment. Then the string value conversion process takes place to get a statistical dataset. This statistical data set contains only numerical data in every row of the data set. After that data is split into two data sets that are test data set and train data set by using test and train function. The decision tree is also used to make an accuracy score based on the test and train data set. Lastly, random forest classifiers were also used to get a better accuracy score.
In the next part of this report, the data analysis has been done on the p3 data set. In the beginning, the p3 data set has been read. Then the null value removing process has been done by using the null valve removing the comment. After cleaning the data a statistical data set has been generated. After that test and train functions are used to split all the data into two data sets that are test and train data sets. Then linear regression has been applied in this test and train data set to produce a linear prediction plot on this respective data set. Then a random forest classifier is also used to produce a random prediction plot based on this data set.
The comparative study of this report comes with the analysis and results of the dataset where the accuracy of that generated model and graphical representation has been described accordingly. The report describes different classifications and regression methods to display the accuracy of each model respectively.
The two dataset geographical and socio-economic data has been implemented using the ML models where the different classification and regression has been visualized. The report describes the decision tree, random forest classification, and "support vector machine" to determine the accuracy score of that fitted model. The implementation of these three classifications describes their relative performance along with their accuracy.
First, the data has been imported into the Python software platform, using different library functions and visualized accordingly. The dataset is the representation of huge data in a tabular form that will be generated through the hotel system. The taken dataset contains several null and missing values that can decrease the overall performance and efficiency of that generated model. The preprocessing of data describes the data mining technique with an understandable format that transforms the raw data into a suitable format. The preprocessing of data has been described with the null value checking, string to integer value conversion, and the missing value deletion.

The above figure describes the null value checking command, and it visualizes the null value along each column.

The above figure describes the drop function of null values, along with each column, and the produced dataset has been reduced. The reduction of rows from the dataset delivers the data with an understandable format that gradually increases the test accuracy.

The above command describes the string value conversion with numerical values, the report implements the ML techniques into the geographical and economical data where the target columns consist of the string value that has been converted into numerical value to apply the ML algorithms. Splitting the dataset into train and test data evaluates the performance of the ML algorithm and it configures the data to fit the model accordingly. The training and testing dataset comes with the target variables and they are fitted respectively to generate the accuracy of that ML technique. Train and test splitting has been implemented using the "sklearn_train and test" splitting functions then different models have been generated with their accuracy percentage.
The report first implements the decision tree classifier on the train and test split dataset, it is a type of supervised ML method that explains the input and corresponding output from the training data.

The above figure describes a cross validation, it evaluates ML models with number of subsets with the available input data and their evaluation as per requirement.

The main focus of this research work is to analyze a data set that gives data related to hotels information. This research motto is to find out the list of most suitable or profitable hotels list. In this part, a data set that has been chosen is "p2_data.csv". In the previous part, the data cleaning procedure has been done. This cleaning process helps to remove all null values from the data set. After this, the statistical data set has been developed by converting string data into integer data. By this process, a statistical data set has been developed that is more suitable for this analysis process.

After getting a statistical data set the test and train function has been applied to split the dataset into two parts. The above figure shows the test and train functions that are applied in this dataset. This splitting process can divide the data set into x and y sets. Here the test set carries 20% data and the train set carries 80% data from the data set.

The decision tree classifier has been used for this split data set. It is a type of supervised machine learning method that explains the input and its corresponding outputs from the training dataset. This decision tree classification generated a binary tree like structure that gives a fair result of this analysis process.
The above figure shows the accuracy score that has been generated in this analysis process. The test and train function is used to produce this accuracy score. Here the accuracy score is 0.78 that is up to the mark.

After getting an accuracy score a random access classifier has been used to get a better accuracy score. The above figure shows the application of a random access classifier in this analysis process. The random access classifier consists of many decision trees where the prediction accuracy has been increased. Here the estimated output that has been generated is 100.
This additional comparative study consists of analysis and results of the data set where the linear and random prediction graph has been generated. In this research work various classification and regression, processes have been done to produce prediction graphs.
In this part, data analysis has been done on a data set that contains geographical and socio-economic data. Linear and random regression has been done. These two types of regression processes help to generate a better prediction graph. This entire data analysis process has been done on the jupyter notebook platform by using python language.

In this part of the analysis process, data has been analyzed from another data set. Here the chosen data set name is "p3_data.csv". At first, the data set is imported into the python platform. The data set contains a large number of data related to the hotel system. This entire data mining process has been done after importing some important packages. The above figure shows the comments that are used to check null values in the data set. The data set contains a lot of null values and other unwanted characters. These all unwanted characters and null values have been removed by this cleaning process of the data.

The above figure shows the data processing procedure. This data processing helps to remove all null values and missing values from the data set. After completion of this data processing procedure, a statistical data set has been developed. By this data processing, all null value rows have been removed which helps to generate a better result of this analysis process. After this cleaning process, get a statistical dataset that contains only numerical values in the rows. This statistical dataset is the best choice for the data mining process to apply ML algorithms.

It evaluates ML models with number of subsets with the available input data and their evaluation.
In this research work data analysis has been done by applying ML algorithms. This process has been done on a data set that is "p3_test.csv" that holds all information about hotels systems. The data cleaning process has been done on the above part. By this cleaning process, all null values rows have been removed from the dataset. In this part of this analysis, process results have been analyzed by using linear and random regression processes. After that, the generated graph has been analyzed.

The above figure shows the data splitting process by using test and train functions. By this function, the data has been split into a train and test data set. This function also configures the data that fit the model accordingly. To apply this function "sklearn test and train" comment has been implemented. Then different models are also implemented to generate accuracy scores.

The above figure shows the comments that are used to impose linear regression in this process. The linear regression here is used to fit a linear model with confidence. The model is fit into the train and tested data set.

The above figure shows the generated linear regression prediction plot on the train data set. The train data set prediction plot gives a satisfactory result.

The above figure shows the linear regression prediction plot on test data sets. This prediction plot gives satisfactory results.

Here random forest classifiers are used in the test and train split data sets. This random first classifier makes an aggregate prediction with the help of multiple decision trees. By using this classifier a random prediction plot has been generated.

The above figure shows a random prediction plot by using multiple decision trees. This random forest classifier is used here to produce this random prediction plot that gives a satisfactory result for this analysis process.
The main focus of this report is to produce a list of suitable hotels that give better facilities and profit. There are two defined data sets based on this data set, this entire analysis process has been done. This entire process of analysis has been done by reading the data from this large data. Classification, regression, clustering, and rule mining techniques of ML are used to complete this data analysis process. In the first, the decision tree and random first classifiers are used to generate an accuracy score. The accuracy score of this analysis process is 0.78 which is up to the mark. In the second part of this analysis process linear and random regression has been done to generate a prediction plot based on the test and train data set. This test and train data set has been developed by applying test and train functions. After appalling all methods and techniques a list of hotels has been obtained that gives better information about the hotel system.
Future work
Machine learning with regression and classification can further improve huge amount of data and their storage accordingly. Data mining and their ML technique will improve the hotel revenue further. Different accuracy score produces a comparative study between those ML techniques, and implementation of right algorithm will further improve the system accuracy.
Get Better Grades In Every Subject
Submit Your Assignments On Time
Trust Academic Experts Based in UK
Your Privacy is Our Topmost Concern
offer valid for limited time only*