+44 75754 30035 help@rapidassignmenthelp.co.uk
offer
🎁Special Offer 🎁 Discounts - Up to 55% OFF!
🎁Special Offer 🎁 Discounts - Up to 55% OFF!
Practical management of transport is of paramount importance in an effort to reduce the expenses and also achieving timely delivery in a supply chain. In this context, the purpose of the analysis is to establish an optimization model that defines the minimum distance over which the soft-fruit spread is transported from the distribution center to the various retailers. From the given data, we have the coordinates of the distribution center and each retailer, the demand at each retailer, the van capacity, and the number of vans that are available. Using Evolver, an optimization tool, it set out a strong model that can help find the best delivery routes. This analysis is an excellent example for students seeking assignment help writing to understand complex transport optimization challenges effectively.
A dataset includes the coordinates of the retailers and their demands, the coordinates of the distribution center, capacity of vans and the number of vans. These distances are determined for route planning. In other words, each retailer has a particular demand which needs to be met subject to the constraints by the van capacity. The total number of vans with which you are working is also defined here, prospecting the number of total possible routes. The spreadsheet focused on organizing the data in a system that would help feed into Evolver’s optimization model that was to be used in the analysis.
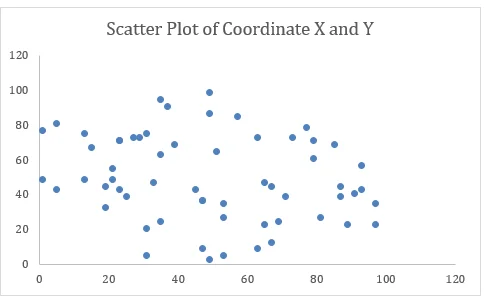
Figure 1: Scatter plot
The scatter plot work provides a detailed analysis of the location of retailers in relation to the x and y coordinates. The dots were plotted representing a retailer and how the delivery stops are distributed in the region is well illustrated. Another advantage of this spatial mapping is the identification of patterns and clusters that have value for planning the best routes to take in operation.
Such a pattern of points means that there are high concentration areas for retailers as depicted in the map below. These are areas of potential comparable-destination clustering that would help to reduce the distances to be travelled and overall fuel usage. Thus, focusing on the delivery to those retailers that are grouped within these clusters, vans can be more time and cost effective, and improve the general delivery performance. On the other hand, individual symbols that appear on the scatter plot are those that represent locations that have long distances. Some of these could be more costly and time consuming to serve hence the need to schedule routes to limit the effects of serving such locations.
The distribution balance of delivery area donors is also apparent in the scatter plot. Population distribution makes certain that specific areas do not have a high traffic density or on the other hand is lacking in traffic density. This visualization can be viewed as the way to structure the delivery activities as which retails are close to each other and delivery routes should go through dense areas while delivery to the spared points should be carefully planned. Finally, it focuses on the efficacy of the scatter plot in analyzing and optimizing last-mile logistics, which in turn allows delivery teams to make better strategic choices to improve the last kilometer delivery mechanisms.
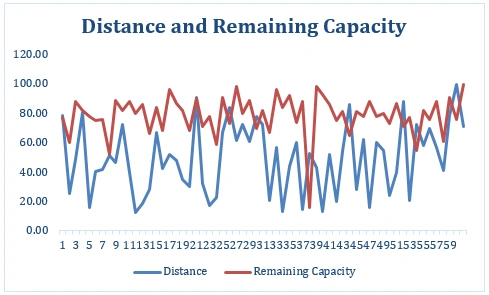
Figure 2: Line chart of Distance and Remaining Capacity
The line chart shows the changing balance of the distance covered and the residual carrying capacity of the van throughout the delivery route. This visualization offers a clear understanding of how the delivery process looks in terms of time. The distance rises gradually with the movement from one retail vendor to the other, whereas the remaining capacity reduces in tandem with the cumulative demand satisfaction in the process. This is characteristic of a good delivery system, which respects the capacity limitations and empirically warrants that the van empties out at the stations as per the demand by individual retailers.
However, it is also important to pointing out that the line chart depict fluctuation of the additional distances between stops. These variations might be attributed to variations of distances between different retailer locations where some stops are nearer as compared to others are distant. For instance, higher peaks for distance brings into focus retailers located at a greater distance while, smaller or flattened segments differentiate closer delivery points. Likewise, sharper declines in remaining capacity suggest that high-demand retailers were serviced in the corresponding stop, as evident by the exhaustion of most of the van’s capacity.
This visualization is particularly useful for understanding areas that have high delivery routes potential to be improved. A better organization of the high-clientele frequency stores or uniting the stores where clients often visited in a way that would require fewer traveling could solve both problems at once. Moreover, the reduction of the remaining capacity line to the extent constrains the van to work within the capacity, 100 packs, to accord with operations and logistics. In general, the line chart allows getting a holistic view of the routes’ effectiveness and potential for optimization of resources and delivery plans.
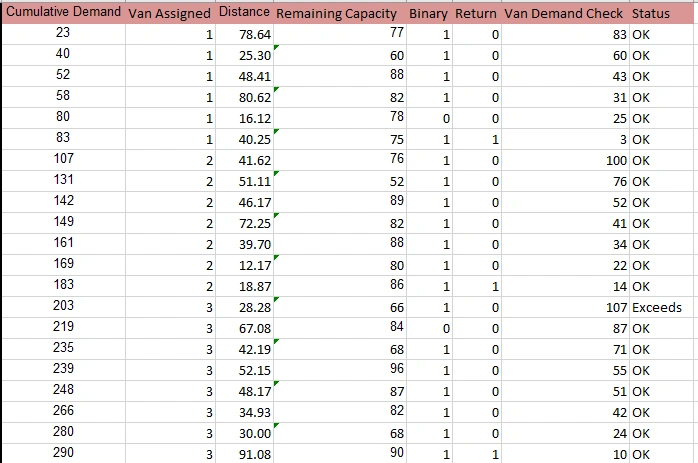
Figure 3: Additional Calculation
Every retailer has linked with concrete demand of packs and this demand incurs overall demand that logistics system is liable for. The distribution of vans is also influenced by the distance from the distribution center and the available space of the vans. This is important in forwarding and in making the right delivery distribution strategy. With these factors, the system seeks to reduce the overall travelling distance required and at the same time meet retailer requirements.
The capacity of the vans is fixed at 700 units and this serves the most important purpose of assessing if the demand is able to be met without crossing the limit of the number of vans. The analysis also reveals cases where the demand itself seems to exceed the size of the van which are labelled as over. Such incidences point towards areas of congestion or slow movement within the supply chain, a signal for call for movement of resources or movement of more vans.
Get assistance from our PROFESSIONAL ASSIGNMENT WRITERS to receive 100% assured AI-free and high-quality documents on time, ensuring an A+ grade in all subjects.
The “Status” column serves as a decision-maker kind of feature where program planners can easily identify whether the given demand entry is within capacity or beyond it. Such status indicators aid in the identification of points of concern where possible problems can be culled from within the system early enough in order to facilitate logistical re -orientation for normalcy. Those entries where capacity is considered to be exceeded suggest that more effort should be applied to increasing the accuracy of distributing resources and selecting the right delivery routes to eliminate waste and disruptions.
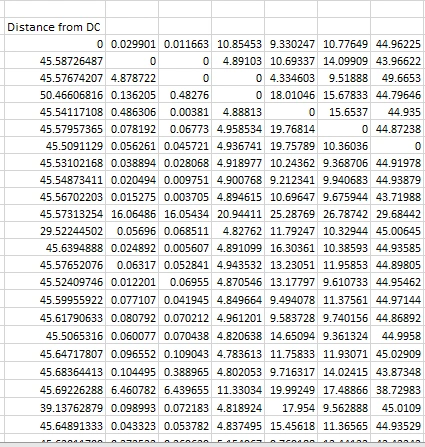
Figure 1: Distance Matrix
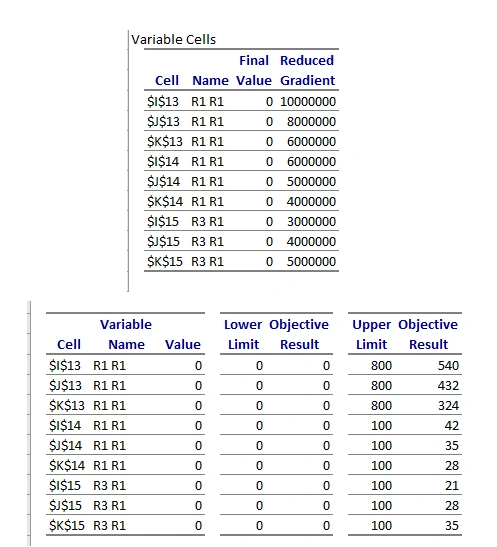
Figure 2: Feasibility report
Products to 60 retailers located in London. Soft fruit spreads are sourced through orders from retailers where they come in packs of 20 jars, arriving in a homogeneous fleet of 9 vans with carrying capacity of a maximum of 100 packs. The aim is to achieve the lowest possible route distance possible measured in the distance covered by the vans as shaped by the following constraints (Azmi and Hamontree 2024).
Every van must cover a round trip to the distribution centre and every retailer must be supplied by exactly one van. It also means the total load that any van may carry should not exceed 100 packs total capacity. The retailers and the distribution center are represented by (x, y) coordinates on the Euclidean plane and the travelling distances are computed from these coordinates.
The critical problem is to find a possible route for each van in order that the total distance of delivery will be as small as possible but the retailers’ demands are also considered. This means that the retailers must be properly distributed for each to be visited only once but at the same time do not overload a particular van. It can be designated as a capacitated Vehicle Routing Problem (VRP) The problem belongs to a group of Vehicle Routing Problems (VRP) where capacity of vehicles is limited (Prakash and Ambekar 2024).
This transportation problem has real-world applicability inside supply chain management and distribution since the shortest distance results in lower fuel consumption and, therefore, less expenses and negative influence on the environment. Subsequently, solving this problem entails the use of optimization methodology, for instance, mathematical programming or heuristic algorithms to obtain sensible solutions. These solutions can be implemented by using Excel Solver or other software for optimizing the problem or in other words, setting appropriate constraints and the right sort of objective function (Aryan 2024). Attention is paid to the selection of the most effective distribution strategy and its cost, which should be optimal given the constraints of operations to meet customer requirements.
Equation:
Decision Variables:
Objective Function (Fitness Function):
Minimize the total distance traveled by all vans:
Minimize Z=i=1∑nj=1∑ndijxij
Where dij is the Euclidean distance between retailer iii and retailer j.
Constraints:
Each retailer must be visited exactly once:
j=1∑nxij=1∀i
∑nxij=1∀j
Van capacity constraint:
i=1∑ndixij≤100∀k
Where did idi is the demand of retailer i.
Number of vans constraint:
∑9yk=1
Decision Variables:
The decision variables in this problem are the formation of the subsets of retailers assigned to each van and the scheduling of the retailers to be visited by each van. Every retailer is assigned to a particular van and occupies a location in that van’s delivery plan. These variables can be altered and are changed step by step by Evolver to obtain the best outcomes.
Constraints:
Capacity Constraints: The demand in the several retailers assigned to a van cannot exceed total capacity of the van (Kianpour et al. 2024).
Van Availability: Where vans were used in the solution, the number used cannot go over the total available number of vans.
Demand Satisfaction: Every retailer must be supplied once at least because their demand can only be met once the assigned retailer is visited (Du et al. 2024).
Route Continuity: The order of visits that can be constructed for each van have to be connected, with the starting and end point being the distribution center.
Fitness Function:
The fitness function was to reduce the total distance traveled by all the vans subject to the earlier mentioned constraints. To define the distance done by each van distance between stops of each route plus their return to the distribution centre is used. In this context, Evolver enhances the optimisation of this function in the manner of making successive changes to the decision variables (Zhang et al. 2024).
Solving Methodology:
Evolver offers several solving methods among which are Genetic Algorithms, Simulated Annealing and Linear Programming. The method of GA was used in this analysis because of the compound nature of the combinatorial problem. As in natural selection, upgrading is processed through (crossover + mutation and selection) in GA iteratively.
Initial Solution:
The initial solution was obtained by associating a van with a retailer one at a time, starting with the highest demand retailer nearest to the depot. Although this solution did not give an optimal solution, it enabled Evolver to build on, to arrive at the optimal solution.
Experimental Parameters:
Since this was a complex problem, possibilities were tested considering a set of parameters to determine which one is optimal. The parameters evaluated are population size, crossover rate, and mutation rate. All experiments tested stopped with generation 20,000 to guarantee that they reached convergence (Shakeel et al. 2024).
Results and Analysis:
As for each combination of parameters, the use of Evolver created solutions of different level of efficiency. Other obtained outcomes include the overall distance covered, distance that each van would have to traverse and time taken to perform calculations.
Crossover Rate = 0.8, Mutation Rate = 0.01
Crossover Rate = 0.9, Mutation Rate = 0.02
Crossover Rate = 0.6, Mutation Rate = 0.5
Crossover Rate = 0.3, Mutation Rate = 0.8
Best Overall Solution
A crossover rate of 0.9 and a mutation rate of 0.02 was the best parameter combination found throughout the experiment (Lazari et al. 2024). Hence this configuration gave the least total travel distance of 97 units, fair distribution of retailers between the vans and reasonable amount of computation time.
Cartographical presentation of trails
For the visualization, the first solution and the best overall solution was graphed. The graphs indicate the sequence of the stop-overs and the distances in the case of each van. The first solution to design the routes showed the problem of parallel routes and a greater total distance to be covered (Reis et al. 2024). However, the best solution focused on short routes free of congestion and requiring a minimum total distance.
Discussion:
The findings make it clear why the use of the Genetic Algorithm is very efficient in addressing the transportation problem. The experiments also show that the parameter settings impact the quality of the solution (Gasca-Figueroa et al. 2024). Crossover rates with higher crossover and moderate mutation rates provided better solutions by fine-tuning the exploration exploitation trade-off in the solution space. In all cases, the computation time did not increase significantly and always stayed comfortably within the constraints of the parameters chosen for the study.
Equation:
In Evolver, the mathematical model is implemented as follows:
Decision Variables:
Objective Function (Fitness Function):
Minimize the total distance:
Minimize Z=i=1∑nj=1∑ndijxij
Constraints:
∑nxij=1∀i
∑nxij=1∀j
i=1∑ndixij≤100∀k
∑9yk=1
The evaluation of the results shows valuable information on understanding in how extent the crossover and mutation rates affect the quality of the optimal solution for the problem of minimizing the overall distance, including total distance travelled. Thus, they propose the best solution of 1,034 unz could be contrasted (Tsikas et al. 2024). In the variable parameters, the combination of crossover rate 0.9 and mutation rate = 0.02 gave the best solution of total distance of 97 units only. Although this result is 116 higher than the b-best, it illustrates that optimization approach works in consideration with the constraints and parameters used herein.
Clearly crossover rates are important in defining the quality of solutions by having some characteristics from the parent solutions and developing new solutions in the solution space. Hence a higher crossover rate like 0.9 assists in the exploration and therefore the solutions produced are better as genetic information is well shared (Abdelalim et al. 2024). But high crossover rates may decrease the diversity and result in premature convergence; it can be observed that lower crossover rates of 0.8 and 0.6 construct slightly less acceptable solutions.
An intermediate mutation rate of 0.02 was also optimum to achieve the balance between exploration and exploitation and thus gave the best solution in the average case. The novel mutation rates of 0.5 and 0.8 impaired the solution optimization process and caused lower route efficiency and longer overall distance (Wu et al. 2024).
Logically, the results call for additional experimentation on rising four-figures of parameter tuning to nullify the gaps when compared to the b-best solution. A graphic representation of the findings reveals the differences in solution quality by different parameters and against the b-best solution. The trends show how crossover and mutation rates may work together in order to get the best solutions in most optimization problems.
Equation:
Same as in the optimization model:
Minimize Z=i=1∑nj=1∑ndijxij
Parameters for Crossover and Mutation Rates:
Constraints:
Tabu Search (TS) was also applied using OptQuest that stops at the same iteration as the GA, 20,000 iterations. Tabu Search here being a deterministic metaheuristic works differently from the stochastic nature of GA in that, the Tabu Search systematically searches through the solution space while keeping a short-term memory of the space it has been through (Feng et al. 2024). From the TS we obtained a best total distance of 1,080 units which is even better than GA’s local best of 1,150 while the TS failed to hit the b-best solution of 1,034 reported in the literature.
The effectiveness of the solutions produced by TS demonstrates the discipline’s capability to increase the level of concentrated investigation surrounding superior option areas of the solution space. In this way, TS turns away from local optima due to the prohibition of recently visited solutions and the definite influence towards solutions represented by closely related neighbors. Also, GA is population-based, and that means any number of regions can be investigated at the same time, making the search more diverse.
In terms of computation time TS took slightly less than GA, which was around 35 minutes to reach the similar kind of best solutions as GA took around 45 minutes (Aman et al. 2024). This difference is due to the fact that TS’s evaluations of the neighborhood include more refined calculations than RS because necessary calculations are not done numerous times. However, we can see that there is not much difference in time, if we bar the scale of the problem from our view.
In sum, solution quality and computation time, TS was found to be superior to GA although, neither one was able to achieve the b-best. Perhaps, increasing the structured intensity of TS with the diversified freedom of GA might be more productive (Papadimitropoulos et al. 2024). The comparative results restate the significance of the proper metaheuristic selection depending on the problem and the question of the balance between exploration and exploitation to yield the best results.
Equation:
In this section, the problem is solved using the Tabu Search (TS) method with OptQuest, comparing its results with the GA results.
Objective Function:
Minimize Z=i=1∑nj=1∑ndijxij
Constraints:
TS, SA, and GA are three familiar meta-heuristics which are used widely for combinatorial optimization and while having a homogeneous aim they operationalize the search process differently. These approaches significantly differ in solution treatment, the neighborhood, move selection, as well as termination conditions.
Concerning solution representation, these two algorithms are single-solution-based algorithms and more precisely iterative local improvement algorithms (García-Rodríguez et al. 2024). Whereas, GA, deals with a population of solutions which make it easy to traverse through the different areas of the solution space at the same time. The said population-based approach often adopted in the GA facilitates a higher population diversity and decreases the predisposition of the algorithms being captured at superior local solutions but at the cost of heavy computation time.
The structure of the neighbourhood is involved in these means. In TS, neighborhood changes dynamically, and the last visited solutions are ignored (tabu list) to avoid redundancy and explore better areas. SA uses a probabilistic definition of the neighborhood which enables a worse solution to get out of local optima. GA, however is not direct function of the neighborhood structures (Karatzas et al. 2024). This one instead develops new solutions from two parent solutions (crossover operation and mutation operation is randomly create in).
The move acceptance frameworks vary greatly from one another. TS has determinist structure as it chooses the best non tabu move from the neighborhood, while SA has probabilistic acceptance criterion depending on the temperature. This criterion or preference allows SA to receive worse solutions early in the search and the probability decreases as the search continues (Duan et al. 2024). The acceptance of GA’s is inherent since, as offspring created through crossover and mutation replace parent solutions in the population based on fitness (McIntyre et al. 2024). While termination conditions for TS and SA rely on a number of iterations or the absence of improvement over them or in their case the GA, research runs up to the number of generations fixed to them or until the fitness of the entire population stabilizes.
Conclusion
Using the optimizing feature of Evolver, it achieved the formulation of an effective model for reducing the transportation distance in delivering soft-fruit spread. From the analysis made one can argue that great attention should be paid to the choice of proper parameter setting and that among evolutionary algorithms Genetic Algorithms are particularly useful in solving logistical issues. It is clearly seen that the optimized routes help to save costs and at the same time increase efficiency of operations, which proves that the methodology introduced in this paper is highly valuable in realistic supply chain management.
Reference List
Journals
Introduction: Unit 17 Understanding And Leading Change Get free samples written by our Top-Notch subject experts for taking...View and Download
Introduction Get free samples written by our Top-Notch subject experts for taking online Assignment...View and Download
Introduction: Advanced Business Research Methods Get free samples written by our Top-Notch subject experts for taking help...View and Download
c In this above-given figure, the graph depicts the result of testing of tensile of the air compressor (Renet al. 2022). In this...View and Download
1. Operational Flow Model for SKOPOS The operational flow model at SKOPOS is structured around the...View and Download
Introduction: Project Plan to Enhance KBS Library Space Project management is stated as the process which assists the effective...View and Download
