Importance of Data Normalization in Effective Data Management and Fundamentals by Rapid Assignment Help in this Sample
The safest way to handle data these days is my managing them and keeping them categorised so that the whole process stays clean and sorted. This process will help to analyse data even more easily that means the organisations will be able work in advance by handling and using the database. Here a dataset is provided and that will be further cleaned and cropped to analyse it properly. The main task here is to understand the huge amount of data by cutting it down to a clean form. The normalisation of data will assist all the tasks that are going to be performed in this project. Normalisation is known as the essential kind of process in which the information is organised in a proper way so that users can easily utilise data and perform further analysis and queries. There are some objectives that represent while performing a data normalisation and the first objective is to eliminate all the duplicate data that are present inside the dataset; this basically means the elimination of redundancy that arises sometimes. The process of redundancy has the ability to affect the whole data analysis the values get changed then required. The data set that is going to be analysed in this assignment is based on the pollution that is occurring in the air and the place where the analysis will happen is “Bristol”.
Explore free assignment samples crafted by our subject experts and take advantage of our online Assignment Help UK services for top-quality support. The importance of these concepts can be widely appreciated in computer science assignments, especially those involving database query optimization and data cleaning techniques.
The cruciality of Data normalisations Has a huge impact on the process of analysis. it can perform many changes inside the data set to make it properly designed and well organised. a normalised data set has the ability to function well and to maintain the order of the process. The data normalisation has the ability to eliminate the anomalies which causes to make the information more difficult to access. There are some anomalies that can perform the activity of cropping from the deleting information and also add more information and up to date with information which are already present (Schöpfel et al. 2018). It is observed that when these get eliminated from the system it gets easier for users to gain advantage while using the Data Analytics.
Different normalisation might be conducted in a particular way that help to analyse and visualise the process a company that gathers huge amount of data cannot simply use the data without cropping it and clean it they have to go through you many cutting process before jumping to the designing of information in a useful way. The advantages of data normalisation help to engage the organisation with the information so that the outcome can be more impactful and at the same time they are some beneficial sides of the process that consist of low space. When raw data is collected it consists of many duplications which is the reason for weakening the data set. In that case, to make it more impactful and advance and reduce the size of the data set the process of normalisation needs to be performed. Managing the data is the procedure of gathering, storing, and utilising information in a systematic, productive, and expense manner. The purpose of information arrangement is to assist individuals, organisations, or embedded devices to optimise data and constraints of policy and legislation ensuring that they might create the choices and conduct steps to boost the profit to the firm. As firms rely primarily on capital resources to segment revenue, a strong data analysis program is most vital.
_632557578e6bc.jpg)
Figure 1: Crop dataset
The data set that is going to be analysed here is based on air quality of a particular country. The data set which is provided from before is basically raw data which has to be further cropped and cleaned to perform analysis and prediction. There are some tasks which are required to be completed in order to meet the requirements (Curry et al. 2019). The first task is all about cropping a huge amount of data set to a small one so that it gets easier for the developer to work with the simple data set. The first step will be to import two libraries those are Pandas and warnings. The first job will be to read the dataset which you will provide and after that there will be a conversion of data types. The variables of date and time will be changed and set it to a particular limit switch all the data before 1st January 2020, after that the update file will be shown and all the lines which are present will be printed.
Get assistance from our PROFESSIONAL ASSIGNMENT WRITERS to receive 100% assured AI-free and high-quality documents on time, ensuring an A+ grade in all subjects.
_63255788499d6.jpg)
_632557b63a23a.jpg)
Figure 2: clean dataset
The same libraries will be imported here also to perform the clean process of the data set. people help to create a data set which has some proper components and patterns so that a user can efficiently work with that status. The process of data cleaning is a system that helps to remove and fix the incorrect data or the duplicate data and even some data which are incomplete within a data set. While adding several data sources in a single analysis there can be too many advantages for information to get mislabelled or duplicated (Curry E. 2020). Some information that affects the whole algorithm and for that reason the analysis becomes unreliable even though it looks perfect from outside. It depends on the analysis that how the data cleaning process will be performed because all the data are not the same and, in that case, there are several ways of cleaning a dataset.
_632557e388d14.jpg)
Figure 3: ER model
This Entity relationship model will help to understand how all the variables are connected with each other or so it will represent all the variables that are present inside a single entity. The two first entities that are going to be present in this model are measurement and Geolocation. We can already see in the above model there are multiple properties of the entity call measurement and those are ID, some different components that are present inside the air, the temperature of the air and the pressure of the air and lastly the siteid (Hassan et al. 2019). The second entity also has many properties like siteid, latitude, longitude, location, instrument type, the start date, end date and current date.
_632557fedfbbd.jpg)
Figure 4: SQL file for Pollution
_6325583489226.jpg)
Figure 5: SQL file for Pollution
This step will be performed using the MySQL forward Engineering process. First There will be some checks that will be performed around the variables. There will be a schema created for pollution DB which will be set as a default character. After that we will create a table where the site ID, longitude, latitude, instrument type, location, data end, current status, start date all variables will be created inside the table and the primary ID in this table will be Site ID (Abiteboul et al. 2018). Next table for the measurement will be created which will have all the variables start a present inside the table and here the primary key will be ID and the foreign key will be siteID. After creating both the table will set the SQL mode to the old mode and the foreign keys and unique checks will be performed.
_63255865920e3.jpg)
Figure 6: Populate file of python
_63255886bae48.jpg)
Figure 7: Populate file of python
Here we are going to perform some query based on Python language over this particular data set. The first step will be to import all the required data sets and those are Pandas, PymySQLcursors And warnings. to generate the queries first have to insert the table that was created in the previous task. First the query called Geoinsert Will be created to Perform the query in order to do so first you have to insert the table and then there will be both tabs built that will help to add values inside them (Patel S. 2021). The second function will be western the table called measurement. After this step there will be a proper connection between the database to execute the queries. After test execution of queries will be performed the first one will be to try the cursor and combine both the tables in different cases.

Figure 8: Query 1
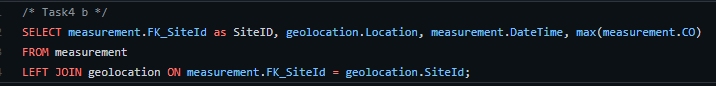
Figure 9: Query 2

Figure 10: Query 3
In this task queries will be executed this will help to make the process even easier for the data analyst. The professional can easily look up to the database by executing some particular queries which are created in this assignment. the whole idea of executing the queries to make the process easier for the person who is dealing with the big amount of data. To reach a Final Decision it is important to receive an outcome which is logical (Diez et al. 2019). My SQL workbench is the best executed when it comes to performing queries because it helps to visualise the tables to the professionals who are dealing with the data set. There are some records and choir in tons relay to and the exact components that are present inside the quality of air need to be determined with the help of these queries.
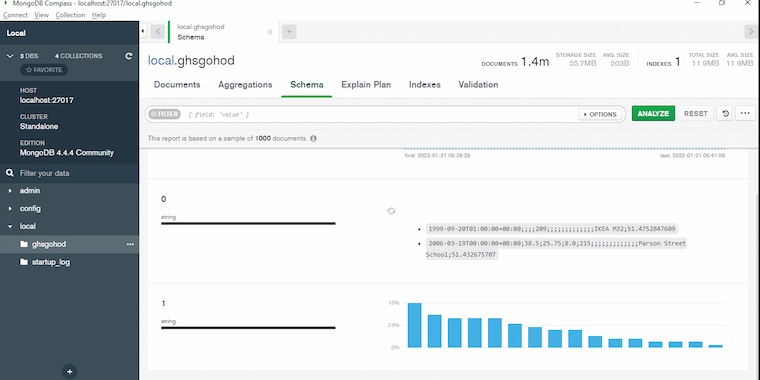
Figure 11: Schema model
The schema seems to be a collection for conceptual datatypes inside a Mysql. The schema, has identical name as the dbms, is owned by a database user. Since about SQL Server 2005, a schema is indeed an independent component (keeper of entities) from the person who creates the item.
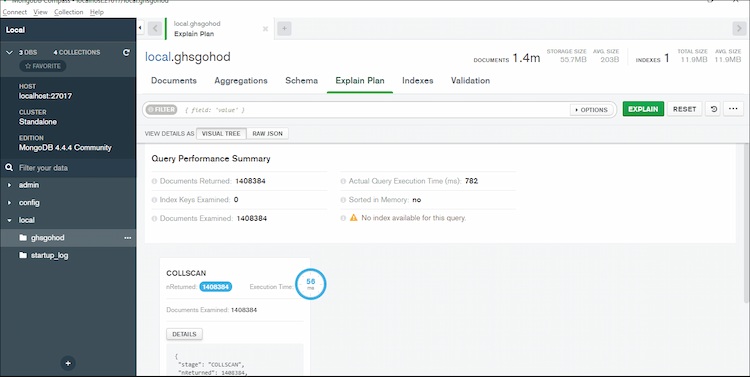
Figure 12: Explain plan of database
To decide the outcome, explain plan executes a real inquiry. While there are some variations between executing the query often with explain, the efficiency will be identical in most cases. As a result, if a query is lengthy, neither is the clarify process.

Figure 13: Object view of database
A viewpoint in MongoDB is a representative object that elements are determined by an aggregate process on other sets or perspectives. Whenever a client requests a service, content is measured on the fly. Users may be required by MongoDB to consume authorization to access the service.
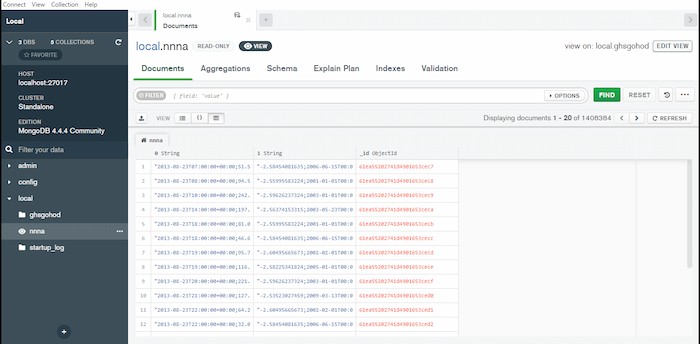
Figure 14: view of documents
Call find() also with criterion> argument to discover items that fit a list of eligibility criteria. MongoDB includes a number of query variables for specifying the parameters.

Figure 15: Updated schema model
A schema is indeed a JSON document that specifies the data's content and structure. Realm's BSON schemas, that implement the JSON Schema specification, may be used to design the user's database schema and verify items as they are generated, updated, or removed.
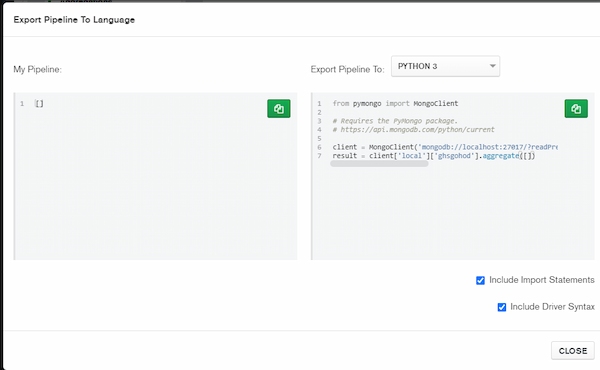
Figure 16: Exportation of pipeline to language
One may convert the completed pipeline in several of the following languages, which include Java, Node, C#, and Python 3. This functionality allows users to easily prepare and export pipes developed in MongoDB Prism for usage in other projects.
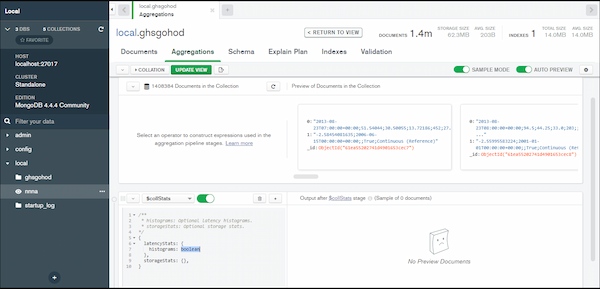
Figure 17: Aggregation of stats
A data aggregation pipeline usually made up among one maybe more phase that handle files: Each step operates here on input sentences in some way. A phase, for instance, can filter records, organise records, and generate values. The materials generated by one step are fed into the next.
Benefits
Big data management is a critical topic that must be addressed as business data warehouses increase tremendously. This is a difficult subject since handling huge data is becoming increasingly difficult for corporations. Big data management generally entails putting in place the proper technology, policies, and people to assure the consistency, integrity, and safety of those huge volumes of data from just a data standpoint.
Despite the numerous problems connected with big data management, its adoption yields a number of benefits. Such as:
Increased income: Organisations may boost their revenue by properly managing their data. Furthermore, it improves the data optimal solutions, which helps to increase income.
Stronger advertising: Because efficient big data management improves information quality, advertising benefits from advanced analytics as well. These enhancements are the result of regular and targeted client interactions (Majid U. 2018).
Cost savings: As productivity improves, cost cutting improves. Attempts to organise massive data assist to cut costs.
Competitive advantage: big data processing provides a market edge since good advanced analytics methods enable statistics, giving businesses an edge over its competitors.
Future Recommendation
Big data management, along with all other disciplines, adheres to specific best recommendations in order to overcome problems and maximise the return from activities. Numerous best practises have been implemented. Most of these practises involve managing skills to increase the revenue output. Firstly, Involve team individuals from various departments in big data management activities. It entails a variety of tasks such as strategy development, corporate culture transformation, and policy development. This is simply an investment in technologies. This is a massive undertaking that requires the participation of as many parties as possible. Secondly, A well-planned procedure for data structures management is required (Orlovskyi et al. 2021). As previously said, big data handling is frequently related with data monitoring and management, therefore having a defined policy is necessary. This guideline must be followed by everyone in the organisation. Furthermore, it is used as one of the compliance strategies in many firms. Lastly, Put the money on staff coaching. Because there is a scarcity of massive data expertise in the industry, a skill set for big data should be established. Companies may gain by training their current users, which is unquestionably a win scenario.
Conclusion
The project is mainly based on working with a huge amount of dataset and measuring the quality of the air in a particular place which is Bristol in this case. The analysis of data management needs to maintain many small steps and then only it can reach a decision that helps to deliver the final outcome. In this project the management of data will be executed by first organising a huge amount of raw data and after that the whole dataset will be cleaned also to make it efficient for the analyst or users. After that the python script will help to perform some queries that are essentially required to maintain the quality of the database. Lastly there will be proper tables created which will help to categorise the data and execute 3 queries based on that. Although there are many possibilities of illustrating the process even more in the future based on requirements.
Reference List
Journals
Introduction Get free samples written by our Top-Notch subject experts for taking online Assignment...View and Download
Introduction:Work Related Learning Get free samples written by our Top-Notch subject experts for taking onlineAssignment...View and Download
Introduction Get free samples written by our Top-Notch subject experts for taking online Assignment Help services. A...View and Download
Introduction: U18655 Financial Reporting U18655 Financial reporting is defined as the process through which effective...View and Download
Introduction Get free samples written by our Top-Notch subject experts for taking online Assignment...View and Download
Introduction- NS4101 Law and ethics for Nurses In this essay, three threads are being focused: legal aspects of dementia care,...View and Download
Copyright 2026 @ Rapid Assignment Help Services