AC4052QA Financial Accounting ASOS PLC Case Study
Explore this ASOS PLC case study example for insights into financial accounting, statement analysis and the role of accounting information in business decisions.
- Introduction
- Task 1: Ratio Interpretation
- Background of the Business
- Interpretation of Ratios
- Key points or Conclusion
- Task 2: Construction of Financial Statements for Julie Limited
- Income Statement
- Statement of Financial Position
- Task 3: Budget Construction and Analysis
- Construction of Cash Budget
- Construction of Profit Budget
- Type Case Study
- Downloads537
- Pages6
- Words1556
Introduction
Financial accounting is the process of organizing and analyzing all the financial information of a business, such as transactions, accounting values, purchases, and costs. The value of financial accounting can be effectively identified for the biggest organizations that include wider operational areas. Financial accounting helps to minimize complexity in valuing and operational management while reducing financial risk and errors. In the report, the concepts and techniques of financial accounting are aimed to be applied in different objectives presented by the tasks.
Struggling with tight deadlines? Assignment Help For Students from Rapid Assignment Help UK delivers well-researched, expertly written papers on time, every time.
Task 1: Ratio Interpretation
Background of the Business
ASOS PLC is a retail organization that has been operating in the fashion industry, supplying different lifestyle products through digital platforms. The company sells a range of clothing and cosmetic products such as tops, dresses, vests, shirts and blouses, trousers and leggings, workwear suits, skirts, jeans, shorts, jackets and coats, shoes, lingerie and nightwear, and swimwear (globaldata.com, 2025).

Figure 1: ASOS Plc Logo
(Source: asosplc.com, 2025)
The company is currently operating in more than 10 countries, where its primary headquarters is located is located in London, United Kingdom. ASOS plc has a strong market position in the global fashion industry due to its wider operational and consumer base. The current market capitalization held by the organization is £377.68 million, which is very significant compared to its competitors H&M and Zalando (asosplc.com, 2025).
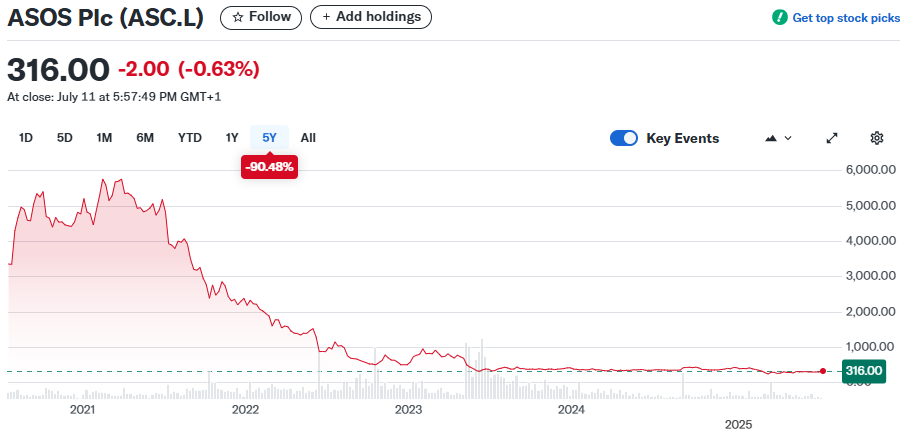
Figure 2: Stock performance of ASOS Plc for Five Years
(Source: finance.yahoo.com, 2025)
The above figure represents the stock performance of ASOS plc for the last five years, which is in a downward trend. ASOS plc share prices have decreased by 90.48% in that particular time frame, with the high share price volatility (Beta) of 2.16. The reason behind the lowering of stock value is entirely presented in the declining financial performance of the company, including both sales and profits. The changes in consumer preference and behavior related to the fashion industry are also a critical factor for ASOS plc.
Interpretation of Ratios
The ratio analysis is a tool that has been used to measure different performance aspects of an organization, such as profitability, liquidity, and efficacy (Rashid, 2021).
Profitability Ratio
The profitability ratio includes the measurement of Return on Capital Employed (ROCE). Return on capital employed (ROCE) is a financial metric that shows how well a company is generating profits from used capital (Nukala and Prasada Rao, 2021). Starting from FY18 to FY21, the ROCE value of ASOS plc is 22.72, 6.99, 12.52, and 9.39. This value indicates that ASOS plc is facing potential problems in generating a profit that is equivalent to its holding or required capital, particularly in FY21.
Efficacy ratios
The operational and financial efficiency of the organization has been measured by the evaluation of Inventory Days, receivable days, and payable days. The inventory days and receivable days of ASOS plc have been presented in a more consistent and satisfactory position. This indicates that the company is effectively managing its inventory over time to maximize profits. These efforts of ASOS plc are supported by timely payments from its customers. However, the payable days of the company increased significantly, which in the long term can affect the relationship of the company and its suppliers.
Liquidity Ratio
The current liquidity level of the organization has been evaluated with the help of the current Ratio (CR) and the Quick Ratio (QR). The CR of the company is 0.81, 1.19, and 1.56 for FY19 to FY21. The improvement in CR indicates that the company's tangible assets far exceed the short-term liabilities of the organization, which helps in presenting financial risk (Widiasmara et al., 2022). In that particular time frame, the QR value of the organization also seems to have increased from 0.11 to 0.75, which indicates that in order to manage the short-term liabilities company’s quick assets, such as cash and market securities, are sufficient.
Financial Structure Ratios
The financial structure of ASOS plc has been analyzed with the help of the gearing ratio, which highlights the current debt portion of the organization compared to its equity investments. The gearing ratio of the company was 2.32 in FY18, which increased to 85.13 in FY21. This result highlights that there is a significant change in the company's capital structure, which aims to generate maximum capital amounts from debt financing (Ezennia and Amahalu, 2024). This decision of the company, although it attempts to improve the returns of investors, can significantly increase the interest expected and financial vulnerability of the organization.
Key points or Conclusion
The conducted ratio analysis highlights that ASOS has shown a sustainable and manageable performance in terms of efficiency and liquidity. However, the company increased in gearing ratio, connected to its higher debt obligations, which is considered to be straining the annual profitability of the organization.
Task 2: Construction of Financial Statements for Julie Limited
Income Statement
| Income Statement for the end of 31 December 2020 | |
| Particulars | Value (£) |
| Sales | 900000 |
| Less: Sales Returns (decreasing Return Amount) | 6000 |
| Net Sales (Sales - Sales returns) | 894000 |
| Cost of Seals | |
| Opening Inventory | 92450 |
| Add: Purchases | 720000 |
| Less: Closing Inventory | 108420 |
| Net Cost of Goods Sold (Opening Inventory + Purchase- Closing Inventory) | 704030 |
| Gross Profit (Net Sales - Net COGS) | 189970 |
| Add: Received Discounts from Suppliers | 6200 |
| Operating profit | 196170 |
| Expenses | |
| Administration expenses | 22000 |
| Repairs and renewals | 5000 |
| Adjusted annual insurance | 20000 |
| Rent (Actual Rent Paid £15000 - Advance Rent £3000) | 12000 |
| Depreciation - Fixtures and fittings (20% of 40,000) | 8000 |
| Depreciation - Equipment (20% RB on £250,000 – £50,000) | 40000 |
| Loan Interest (150,000 at 6%) | 9000 |
| Total Expenses | 116000 |
| Annual profit of the Year (Operating profit - Total Expenses) | 80170 |
Table 1: Income Statement of Julie Limited at 31 December 2020
(Source: Created in Excel)
The above table represents the year-end statement of profit and loss for FY2020. Julie Limited has been identified to genera an annual sales value of £900000. Considering the annual expectations of the company in the year 2020, Julie Limited is able to generate a year-end profit of £80170. The rent expressed to the company is £12000 due to the prepaid value of £3000.
Statement of Financial Position
| Statement of Financial Position at the end of 2020 | |
| Particulars | Value (£) |
| Assets | |
| Non-Current Assets | |
| Fixtures and fittings | 40000 |
| Less: Accumulated depreciation | 24000 |
| Equipment | 250000 |
| Less: Accumulated depreciation | 90,000 |
| Net non-current assets | 176,000 |
| Current Assets | |
| Inventory | 108,420 |
| Trade receivables | 123,200 |
| Bank Balance | 35,400 |
| Prepaid rent | 3,000 |
| Current Assets | 270,020 |
| Total Assets | 446,020 |
| Equity | |
| Share capital | 10,000 |
| Retained earnings (Opening + Profit) | 158920 |
| Total Equity | 168,920 |
| Liabilities | |
| Non-Current Liabilities | |
| Loan (£150,000 − £15000) | 135000 |
| Current Liabilities | |
| Loan Repayment Due in one year | 15000 |
| Trade payables | 115,600 |
| Accrued loan interest | 9000 |
| Total Current Liabilities | 139,600 |
| Total Labilities | 274,600 |
Table 2: Balance Sheet of Julie Limited at 31 December 2020
(Source: Created in Excel)
The evaluation of non-current assets of Julie Limited involves evaluating the depreciation amounts of both equipment and Fixtures and fittings. The Fixtures and fittings depreciation cost is presented through the straight-line method while the equipment’s is depreciated in the reducing balance method (Akan and Kiraci, 2024). The company’s assets are valued at £446,020, while the respective liabilities are £274,600 at the end of FY20.
Task 3: Budget Construction and Analysis
Construction of Cash Budget
| Cash budget for the 6 months | ||||||
| Months | Cash Inflow | Cost of Purchase | Wages and Overheads | Rent | Net Cash Flow | Closing balance |
| Jan | 15000 | 0 | 2000 | 6000 | 7000 | 7000 |
| Feb | 15000 | 9000 | 2000 | 0 | 4000 | 11000 |
| Mar | 15000 | 9000 | 2000 | 0 | 4000 | 15000 |
| Apr | 15000 | 9000 | 2000 | 6000 | -2000 | 13000 |
| May | 20000 | 9000 | 2000 | 0 | 9000 | 22000 |
| Jun | 20000 | 12000 | 2000 | 0 | 6000 | 28000 |
Table 3: Preparation of Cash Budget for OLU Ltd in a 6-month time frame
(Source: Created In Excel)
The cash budget is a type of budget statement that highlights the annual cash balance of the company by considering all the financial components, such as cash inflows and outflows (Cassone, 2024). The table presents the cash budget of OLU Ltd, which reports that at the end of a 6-month operation, the closing balance was £28000.
Construction of Profit Budget
| Profit budget for the 6 months | |
| Particulars | Value (£) |
| Sales Units (Jan - Apr) | 300 |
| Sales Units (May - Jun) | 400 |
| Sales Value | 50 |
| Total Sold units | 2000 |
| Total revenue | 100000 |
| Cost Per Unit Sold | 30 |
| Total Cost of Units | 60000 |
| Gross profit (total Revenue - Total Cost of Units) | 40000 |
| Wages (£1000 for 6 months) | 6000 |
| Overheads (£1000 for 6 months) | 6000 |
| Rent (£2000 for 6 months) | 12000 |
| Total Operating Expenses | 24000 |
| Net profit (Gross Profit - Total Operating Expenses) | 16000 |
Table 4: Preparation of Profit Budget for OLU Ltd in a 6-month time frame

 10 Years | MSc in Accounting
(Source: Created In Excel)
The above-presented profit budget of OLU Ltd for the 6 months of operation highlights that the company is able to make a profit of £16000. In this process, the company’s cost of units sold is going to be 60% of the total generated revenue.
Conclusion
The report presents the scenario of three different organizations in the process of conducting specific financial analysis. The application ratios are able to effectively present the past and current performance of ASOS Plc while constraining of financial statement and budget gives a details observation of the company’s performance and potential.
References
- Akan, E. and Kiraci, K., 2024. Introducing the Novel Depreciation Methods: The Balanced Increasing Depreciation and the Balanced Decreasing Depreciation. Available at SSRN 4701218.
- asosplc.com, (2025). ASOS PLC. Available at: https://www.asosplc.com/ [Accessed on: 14-7-2025]
- asosplc.com, (2025). Share information. Available at: https://www.asosplc.com/investor-relations/share-information/ [Accessed on: 14-7-2025]
- Cassone, D., 2024. Budgeting for your organization. In Leadership concepts for the engineering mindset (pp. 55-64). Cham: Springer Nature Switzerland.
- Ezennia, A.S. and Amahalu, N.N., 2024. GEARING RATIO AND PROFITABILITY OF LISTED CONSTRUCTION FIRMS IN NIGERIA. International Review of Financial Studies, 1(2), pp.1-37.
- finance.yahoo.com, (2025). ASOS Plc (ASC.L). Available at: https://finance.yahoo.com/quote/ASC.L/ [Accessed on: 14-7-2025]
- globaldata.com, (2025). ASOS Plc: Overview. Available at: https://www.globaldata.com/company-profile/asos-plc/ [Accessed on: 14-7-2025]
- Nukala, V.B. and Prasada Rao, S.S., 2021. Role of debt-to-equity ratio in project investment valuation, assessing risk and return in capital markets. Future Business Journal, 7(1), p.13.
- Rashid, C.A., 2021. The efficiency of financial ratios analysis to evaluate company’s profitability. Journal of Global Economics and Business, 2(4), pp.119-132.
- Widiasmara, A., Kusherawati, A., Cahyaningati, R. and Paramita, R.W.D., 2022. The Effect of Current Ratio, Debt to Equity Ratio, Return On Assets, and Net Profit Margin on Profit Growth. Assets: Jurnal Ilmiah Ilmu Akuntansi, Keuangan Dan Pajak, 6(1), pp.8-15.
Recently Downloaded Case Studies by Customers
Introduction Looking for top-notch assignment help? Our Assignment Help service provide expert support, ensuring high-quality,...View and Download
1.0 Introduction Need assignments like this? Assignment Help UK provides expert assistance in neuroscience and psychology,...View and Download
Introduction and Rationale ASD is a neurological disorder affecting about 1% of the population in the United Kingdom that lasts...View and Download
Introduction to The Deepwater Horizon Disaster Of 2010 Case Study British Petroleum (BP) is a well-known UK-based company which...View and Download
Introduction Looking for expert assistance on sustainable entrepreneurship? Our Assignment Help service provides in-depth...View and Download
1. Description The particular case I explored involved a Private Limited Company (Ltd.) that belongs to the fast-fashion...View and Download