+44 75754 30035 help@rapidassignmenthelp.co.uk
offer
🎁Special Offer 🎁 Discounts - Up to 55% OFF!
🎁Special Offer 🎁 Discounts - Up to 55% OFF!
Chronic illness like diabetes, coronary artery disease, chronic respiratory diseases, and other diseases impose heavy health care costs on people and governments. In the United Kingdom, the National Health Service spends large proportions of its financial revenue in handling such chronic diseases and provides relentless cure, medication, alteration of nutrition along with consecutive checkups from physicians. The aim of this research work is to investigate the NHS expenditure on chronic illness over the period of 2019-2022 with a special predisposition to diabetes. Through patterns of expenditure that have occurred and evaluation of the effectiveness of these costs, it is expected to gain a better approach regarding the utilization of available resources. In the research, a dataset will be utilized and these will be represented graphically in excel to show trends of expenditure and provide direction on how available financial resources might be directed to achieve increased benefit for patients in the NHS.
The main aim is to analyze the NHS expenditure on chronic diseases, and its costs relating to treatments, evaluate its costs, and make recommendations regarding how to use it more effectively to improve client results and value.
This section of the Quantitative Analysis of NHS Expenditure on Diabetes Management Assignment highlights the process of data collection from Kaggle, preparation through cleaning and validation, and detailed analysis of NHS costs from 2019–2022. Using regression models, descriptive statistics, and trend comparisons, the study identifies spending patterns across chronic diseases with a focus on diabetes. The findings emphasize cost variations, consultant-led expenditure impacts, and implications for resource allocation, providing valuable insights for healthcare efficiency. For students seeking structured guidance, professional Assignment Help can enhance the quality and clarity of such research projects.
This research data was obtained from Kaggle which is an online platform that has several data science and machine learning datasets. The data used in this research involve the costs incurred by the NHS on chronic diseases in which chronic disease and, particularly, diabetes are of importance. Kaggle is a very large database that is full of datasets provided by different organizations and scholars and Kaggle has already been identified as a suitable place for getting original datasets for analysis. The information available on Kaggle includes detailed information on National Health Service for the prices, patients, the kind of treatment, and its characteristics in the year of 2019 to 2022. The present generation is related to today’s expenditure and consumption. This data contains a wide amount of information that refers to a patient’s healthcare and billings which can be helpful for determining the costs of the treatment of diabetes (Sicari et al. 2022). First the data was screened and cleaned for the purpose of the analysis of the data as provided in the given data. This entailed looking for gaps, suspicious pattern and other information that would provide the best fit picture of the expenditure trends in the NHS. This is because the Kaggle dataset provides a better context for analyzing the trends, efficiency and general patterns of costs of care that is applicable to the NHS Diabetes.
Data Cleaning First Step
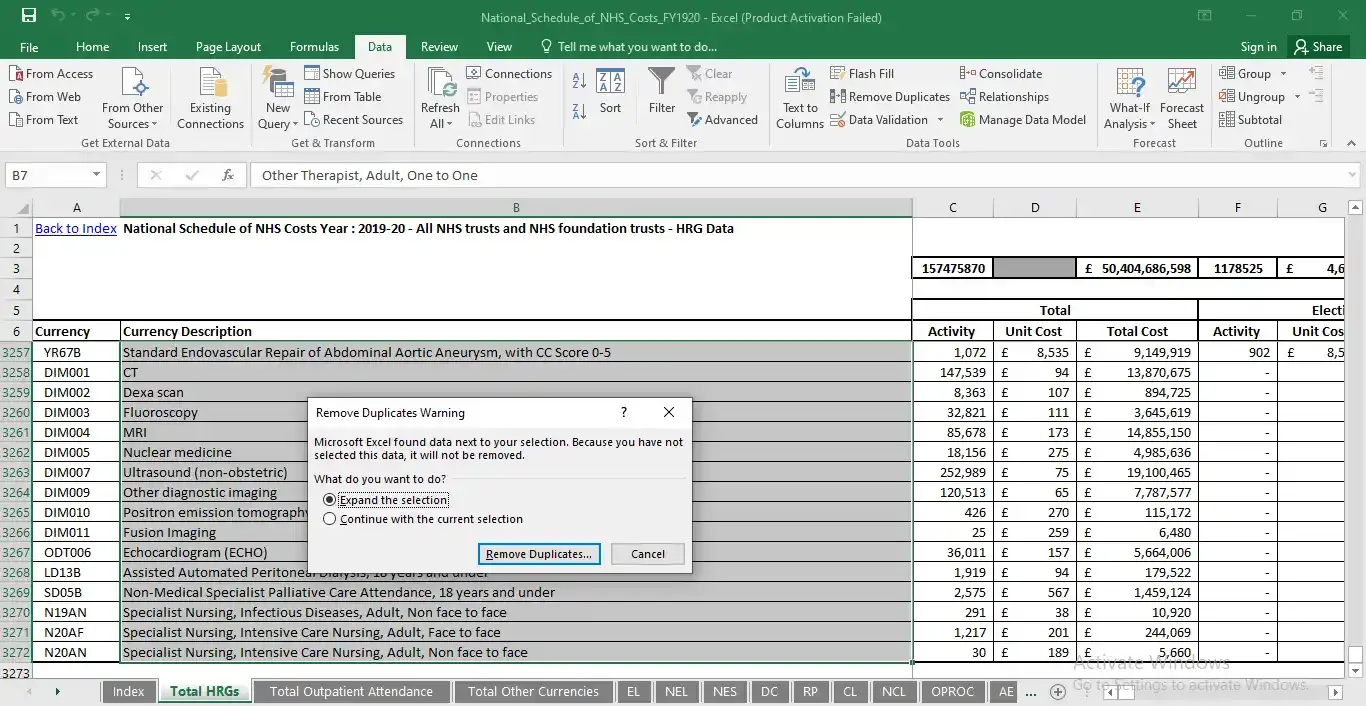
Figure 1: Data Cleaning First Step
(Source: Self-Created in MS Excel)
It is necessary to state that data preparation presents major challenges to increase the clarity and reliability of the NHS expenditure on the management of chronic diseases. Many measures were made to improve the Kaggle dataset for this specific research, which focusses on Breaking down the Costliest Procedures in Public Health: Specifically, this research analyzes the breakdown of the top costly procedures in NHS UK with detailed focus on the spending on diabetes in the year 2019 to 2022. Data cleaning was more about ensuring that any inconsistencies in the data presented were detected and corrected. This involved handling of missing values in the billing amounts and the patient information which either were replaced by related data or dropped in order to minimize size bias. Particular attention needs to be given with regard to outliers in order to make sure that it is correct and does not result from data entry mistakes (Lane et al.2021). After data transformation the data was normalized to ensure that the normality in various fields was considered. These steps involved ensuring all formats were correct, discretizing categorical data where needed and summing billing amounts by groups of chronic diseases, with diabetes at specific focus. These standardizations assist in the orientation of the data regarding the focus of the research to assess and analyze the cost of treatment.
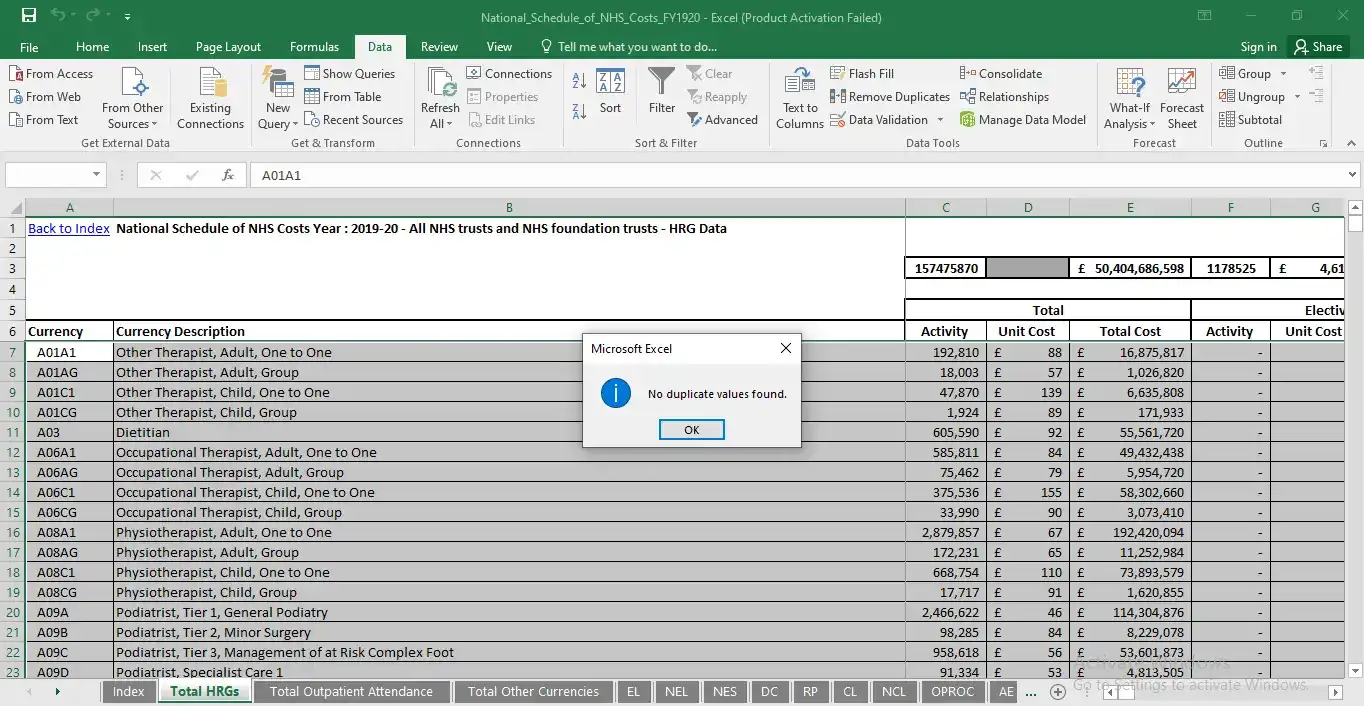
No duplicate data was found after data cleaning
Get assistance from our PROFESSIONAL ASSIGNMENT WRITERS to receive 100% assured AI-free and high-quality documents on time, ensuring an A+ grade in all subjects.
Figure 2: No duplicate data was found after data cleaning
(Source: Self-Created in MS Excel)
Data integration was used to merge data as it was necessary to map concepts such as treatments, billing amounts and acknowledge the standardized categories; It also provides information that such mapping enhanced the dataset for adequate analysis. This was achieved through data validation where the correctness of the dataset was verified through comparison with source documents as well as prior studies. This validation confirmed the continuity of the dataset with the real situation in NHS expenditure on diabetes and other chronic diseases, which was significant for the research for evaluating the expenditure efficiency and trends (Edwards et al.2024). All these preparation procedures were crucial in setting up the foundation for analyzing the most costly treatments under the NHS and deriving understandings regarding how the resources could be utilized in a better manner to boost patient’s values and outcomes.
Analyzing the total cost
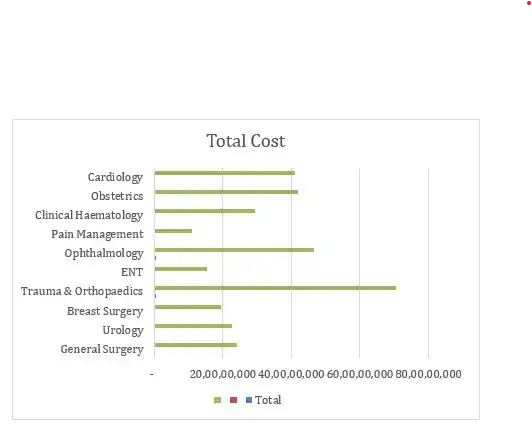
Figure 3: Analyzing the total cost
(Source: Self-Created in MS Excel)
It provides the overall cost of almost all medical specializations as can be seen from the figure below. In the case of specialties, Trauma & Orthopaedics is the most expensive specialty, with costs estimate at 800000000 units of the local currency. This article might be costly because of the kind of treatment being offered, the equipment needed and, perhaps the duration of admission for patients with trauma and Orthopedics. The two next specialties which can cost more than 500 million units are cardiology and ophthalmology (Clarke et al.2022). It is also apparent that many of these occupations are costly due to such factors as having to use diagnostic tools and procedures. Clinical hematology and obstetrics stand between the two and costs approximately 400,000,000 units. Rates of breast surgery, urology and general surgery are nearly equal and cost approximately between 200,000,000 and 300,000,000 units. ENT and pain have a lower cost than other disciplines most likely due to a higher proportion of outpatient services or otherwise using fewer resources. In regard to the resource allocation and in the distribution of expenditures, the cost distribution described above might be beneficial to understand the variations of resource requirements across the medical fields to the hospital administrators and the health policy makers. It also raises doubts about the factors that affect costs related to each specialty, which may in turn become the basis for initiatives to optimize and regulate costs.
Regression statistics 2019/2020
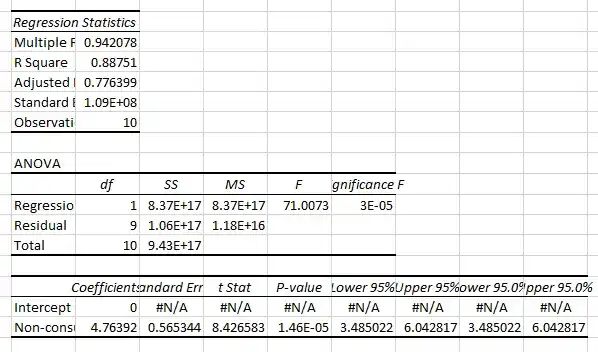
Figure 4: Regression statistics 2019/2020
(Source: Self-Created in MS Excel)
It has been seen from this regression study that there exists a sound consultant and non-consultant link. The non-consultant led variable can be partly hold for almost 88%. They both explained 8% of the variance of consultant led variable, this is according to the high Multiple R of 0. 942 and R Square of 0. 888, showing high and significant positive correlation. The p-value is less than 0. 05 (3E-05) and F-statistic calculated is 71. 0073, which show that the nature of the regression model is quite significant (Withers et al.2023). This means that consultant led values has significant positive association with non-consultant led values and is statistically significant with a p- value of 1. 46E-05 for the non-consultant led variable with coefficient 4. It can also observe that there are both over and under prediction in the residual output thus meaning that there is some inconsistency in the model concerning the forecast of some data. Consequently, the forecasts or the understanding of the relationship between these two variables within health care management could be achieved by employing this technique.
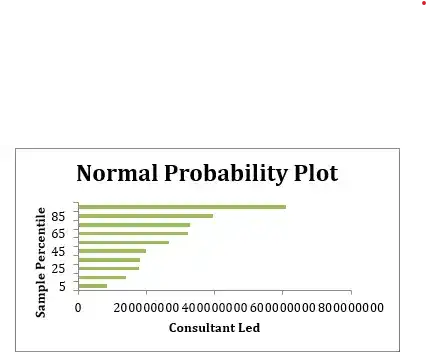
Figure 5: Normal Probability plot
(Source: Self-Created in MS Excel)
The above given Normal Probability Plot depicts how Consultant Led data is distributed with reference to the several percentiles. Percentile of sample is on the Y axis and Consultant Led values are on the X axis. The two sample statistics supported by the general form of the plot are that the trend of the values is almost linear and that it makes a lot of sense that the data is perhaps pretty close to being normally distributed. Slightly departure from perfect linearity particularly on the lower and upper end is usually observed. Therefore, there is evidence of right skewness, whereby there is a steep rise in the values from the 65th and 95th percentile the high values shifting upward the upper tail of the distribution. In consultant-led cases, this may imply there are outliers or there is a positive skewed distribution as a result of nature. The Consultant Led graph plays an important role in establishing the normalcy assumptions and identifying possibly erroneous or patterns that may be useful for further analysis or for convenient use in the managerial decision making in healthcare field.
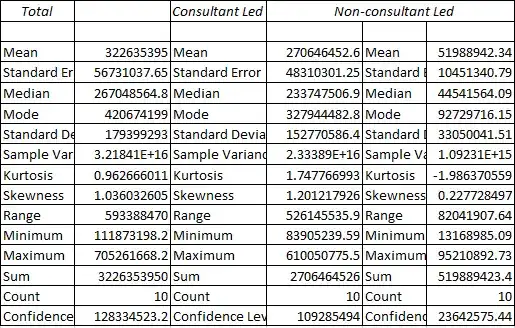
Figure 6: Descriptive Statistics for 2019/2020
(Source: Self-Created in MS Excel)
This statistics summary compare the metrics of total, consultant-led, and non-consultant led measurements. When comparing consultant-led and non-consultant led activities what can be observed is that higher values have been observed and in addition high variability noted in consultant led activities. Regarding consultant led metrics, the mean and median whereby higher than the middle value indicating that, normally, such activities require large amounts. Bigger sample variances and standard deviations are also obtained from the consultant-led data which may mean a higher range of outcomes and possibly more undesirable one. It is evident that both consultant-led and overall values demonstrate positively skewed and positively and/or negatively kurtosis; this illustrates that the data is in some degree right-skewed with heavier tails than in the normal distribution. While the non-consultant led data possesses negative kurtosis meaning that the curve is flat. Within each group there is quite much disparity, as evidenced by the high standard deviations of all accept consultant-led. These estimates are subject to certain level of error due to issues such as the sample size used and variation in sample data, as depicted by the relatively high confidence interval levels of 95%, especially for the total and consultant led categories. This study might be useful when trying to understand resource allocation and performance gaps between consultant-led and non-consultant led activities especially in the field of healthcare or professional services. A comparison between consultant and non-consultant led figures are presented for a range of indicators in this data. In most of the variables, the means and medians of the consultant-led group are slightly higher than that of the no consultant-led group signifying more effectiveness. Larger SD on the other hand depicts larger SV and variability in the population as well since more values are having a chance to be selected (Dunnell et al.2022). Nonetheless, the non-consultant led group displays higher metric Mean, while the coefficients of variation are generally more consistent. It is very clear that majority of the variables have positive skewness in both groups indicating that the variable tends to favor lower values with a few higher than average extreme values. Some of the distributions seem to be more peaked than the normal distribution based on Kurtosis coefficient while others seem to be moreflat. Large ranges are presented by the both categories, which may indicate possible topics for further research or development of the outlier cases in maximum and minimum values.
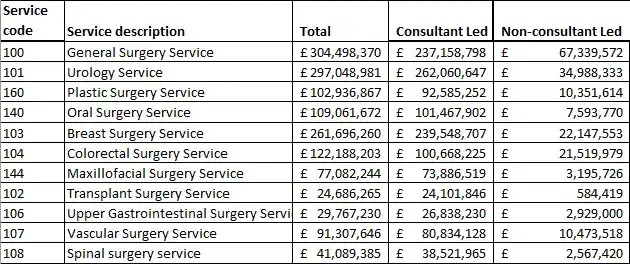
Figure 7: Descriptive Statistics Total For 2021 to 2022
(Source: Self-Created in MS Excel)
It provides an overview of different surgical services and their related expenditures for the years 2021–2022, broken down into three categories: According to the type of organizational structure, there are three types which are total, consultant led and non-consultant led structures. Thus, making costs 29% more; at £304,498,370 it is the most costly sector of activity with urology during the period at £297,048,981 being the second most costly service. The general costs of the operation of both colon and breast cancer related surgeries are also very exorbitant. Using consultant costs, costs are relatively higher among all services so that most of the surgical expenses are on the services or procedures managed by consultants. Most striking is the cost differential between consulting-top and non-consultant top for such specialties as urology, breast surgery, and general surgery. In the detail, one can observe that some of the specialty treatments, like, for instance, upper gastrointestinal surgery or transplant surgery have the overall prices rather low but still, they have a great number of consultant-led costs. Some significant points falling under this data include the distribution of knowledge possessed by surgeons by specialty and distribution of resources, which are critical in decision-making, especially on financial allocations in the health facilities.
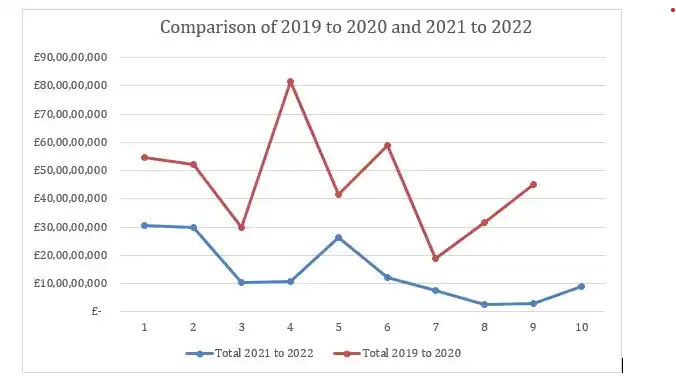
Figure 8: Comparison of 2019 to 2020 and 2021 to 2022
(Source: Self-Created in MS Excel)
The expenditures of healthcare services are presented and compared between 2019–2020 and 2021–2022 to identify the changes in spending trend. The graph shows that almost all the services’ costs went down between 2019 and 2020; the orange line, which represents 2019 and 2020, always lies above the blue line, which is for 2021 and 2022. The tabular data however gives a different picture all together. Both general surgery and urology had increases: from £241,071 552 to £ 304, 498 370 for general surgery and from £ 226, 309 257 to £ 297, 048 981 for urology. In addition, it is important to notice that some of the figures do not contain services data from 2021-2022 for direct comparison with 2019-2020, such as Trauma & Orthopaedics (£705,261,668) or Ophthalmology (£466,658,806) that could be reported differently and may indicate the changes in organization’s structure or accurate reporting. Thus, the new directions for the classification or goals of healthcare in 2021–2022 are introduced with the help of new categories like Maxillofacial Surgery, and Colorectal Surgery. More specifically, the trend analysis for a total healthcare cost between the FY 2019–2020 and FY2021–2022 indicates that there is a drop in the total annual expenditure on health care which may be because of the COVID-19 pandemic affecting the distribution and provision of the health resources.
The analysis of the NHS expenditure on diabetes products provides big differences in cost among the diseases and various treatments. High unit prices and overall expenditures are associated with significant outcomes such as diabetes with lower limb complications and hypoglycemic conditions putting a considerable cost implication. These results indicate that there is a high level of cost variation, as suggested by the relatively higher average unit cost and the standard deviation. From the discussed findings it can be concluded that specific, targeted cost management strategies have to be utilized with regards to the management of the overall resource consumption for diabetes treatment. A good plan might not only assist in the NHS cost reduction but also, the enhancement of the patients’ conditions.
The Quantitative Analysis of NHS Expenditure on Diabetes Management Assignment incorporates project management elements such as planning, collaboration, and reflection. The project plan was structured using MS Project, while teamwork relied on web conferencing, shared files, and project tracking tools to ensure synchronization and timely completion. Collaboration through feedback sessions enhanced the quality of research outputs. The learning reflection highlights the development of key skills, including data cleaning, visualization, and interpretation, while emphasizing the importance of accurate analysis for healthcare decision-making. This reflective approach also identifies areas for future improvement, particularly in mastering advanced data analysis tools to address complex public health challenges.
It states that proper project collaboration was crucial in meeting the scope of this analysis on the expenditure of the National Health Service on chronic diseases. To avoid misunderstanding and to maintain the synchronization of the team, various tools and techniques were used. Web conferencing was used to conduct weekly meetings aimed at reviewing the progress and results of the carried out research while also identifying the challenges that may arise. It used files and worksheets where multiple teammates could work and update every information that was required (Monlezun, 2023). It was made possible through the sharing of data insights and for making sure that all the people involved analyzed the objective and timelines of the project. The project management tool that was used by the entire team was helpful in keeping track of the tasks, responsibilities, goals, and deadlines of the team. Group feedback sessions helped keep a check on what the other team members have done and helped in improving the quality of analysis.
In analyzing the spending of the NHS with regards to chronic illness, there were a lot of things that can be learned from the process. What: The study enhanced my understanding of the level of complication associated with analysis of public health expenditure towards the treatment of diabetes in particular. From the program I gained experience on data cleaning, data organization, and other Excel skills in data visualization. So what? Looking at how much had been spent that value gained made me appreciate the importance of data and the impact which accurate and efficient visualization of data has on decision-making. I understood how to analyze numerical data with the aim of revealing data that affect use of resources. What Next: As with new experiences ahead, I need to apply these abilities in other projects so as to conduct an intensive analysis of the data collected and offer reasonable explanations to the results (Melcon et al.2022). I plan on building further expertise on data analysis tools and techniques that will help deal with complex public health problems along with improving the efficiency of the health sector in financial aspects.
Reference List
Journals
Introduction Get free samples written by our top-notch subject experts for taking the Assignment Help Online from Rapid...View and Download
Introduction The study of Bangladesh in French media and its translation analysis plays a crucial role in understanding how the...View and Download
Introduction Get free samples written by our Top-Notch subject experts for taking online Assignment...View and Download
Part A Part A presents the overall network design and explains why each connection, configuration, and addressing method was...View and Download
1. Primary Healthcare This Health and Social Care assignment sample demonstrates high-quality academic writing with proper...View and Download
Individual assignment – Critical Essay Claims Reserving Swiss Re is one of the largest global reinsurers. Headquartered in...View and Download
