+44 75754 30035 help@rapidassignmenthelp.co.uk
offer
🎁Special Offer 🎁 Discounts - Up to 50% OFF!
🎁Special Offer 🎁 Discounts - Up to 50% OFF!

You might be feeling happy by getting your statistics output but that’s when you need to be careful. The reason is because it is just half the job for professors and they look for the strength of interpretation. As a student, you might be aware of it and the challenges associated with it like table of values, p-value, and correlation.
Now when the question is to showcase whether you understand the results or not, interpreting results appropriately becomes crucial. This is what the blog is all about sharing you the tips to interpret statistics results. That’s when you can end up driving meaningful academic discussion so without any further delay, let’s get started.
Understanding what statistical interpretation isn't rocket science but still valuable to drive impactful results. It is about explaining the meaning and significance of the results you obtained from your analysis. This is one of the crucial stages in assignment that comes after getting the output and turning into a clear explanation. The whole point of that is to help the reader understand the output.
To get an idea of how it works, think of your analysis that shows a correlation coefficient of r=0.72 between study time and exam performance. If you just report the number, it will not tell your reader much. When you explain the results in the way that indicates a strong positive relationship between two variables, you can make it easier to understand.
Now you might understand why statistical interpretation is required to score great marks. However, to know which result to interpret is another tangible thing. Let’s break down next.
One of the trickiest things in statistical tests is that you get a variety of numbers.What to be careful of is that not everyone needs the same level of discussion. It relies on the research question and statistical method. Let’s make it easy with some interpretation used based on results:
|
Statistical Result |
What You Should Consider |
|
Mean |
What is the average value? |
|
Median |
What is the middle value of the dataset? |
|
Standard Deviation |
How much do the observations vary around the mean? |
|
Correlation Coefficient |
What is the direction and strength of the relationship? |
|
P-value |
Is there sufficient statistical evidence to reject the null hypothesis at the chosen significance level? |
|
Confidence Interval |
What range of values is reasonably consistent with the data? |
|
Regression Coefficient |
How is a predictor associated with the outcome variable? |
|
T-test Result |
Is there evidence of a difference between the groups being compared? |
|
ANOVA Result |
Is there evidence that at least one group differs from another? |
|
Chi-Square Result |
Is there evidence of an association between categorical variables? |
Once you know the right statistical result, you are ready to interpret them correctly. That’s when you need to learn how to do it correctly which is explained in the next section.
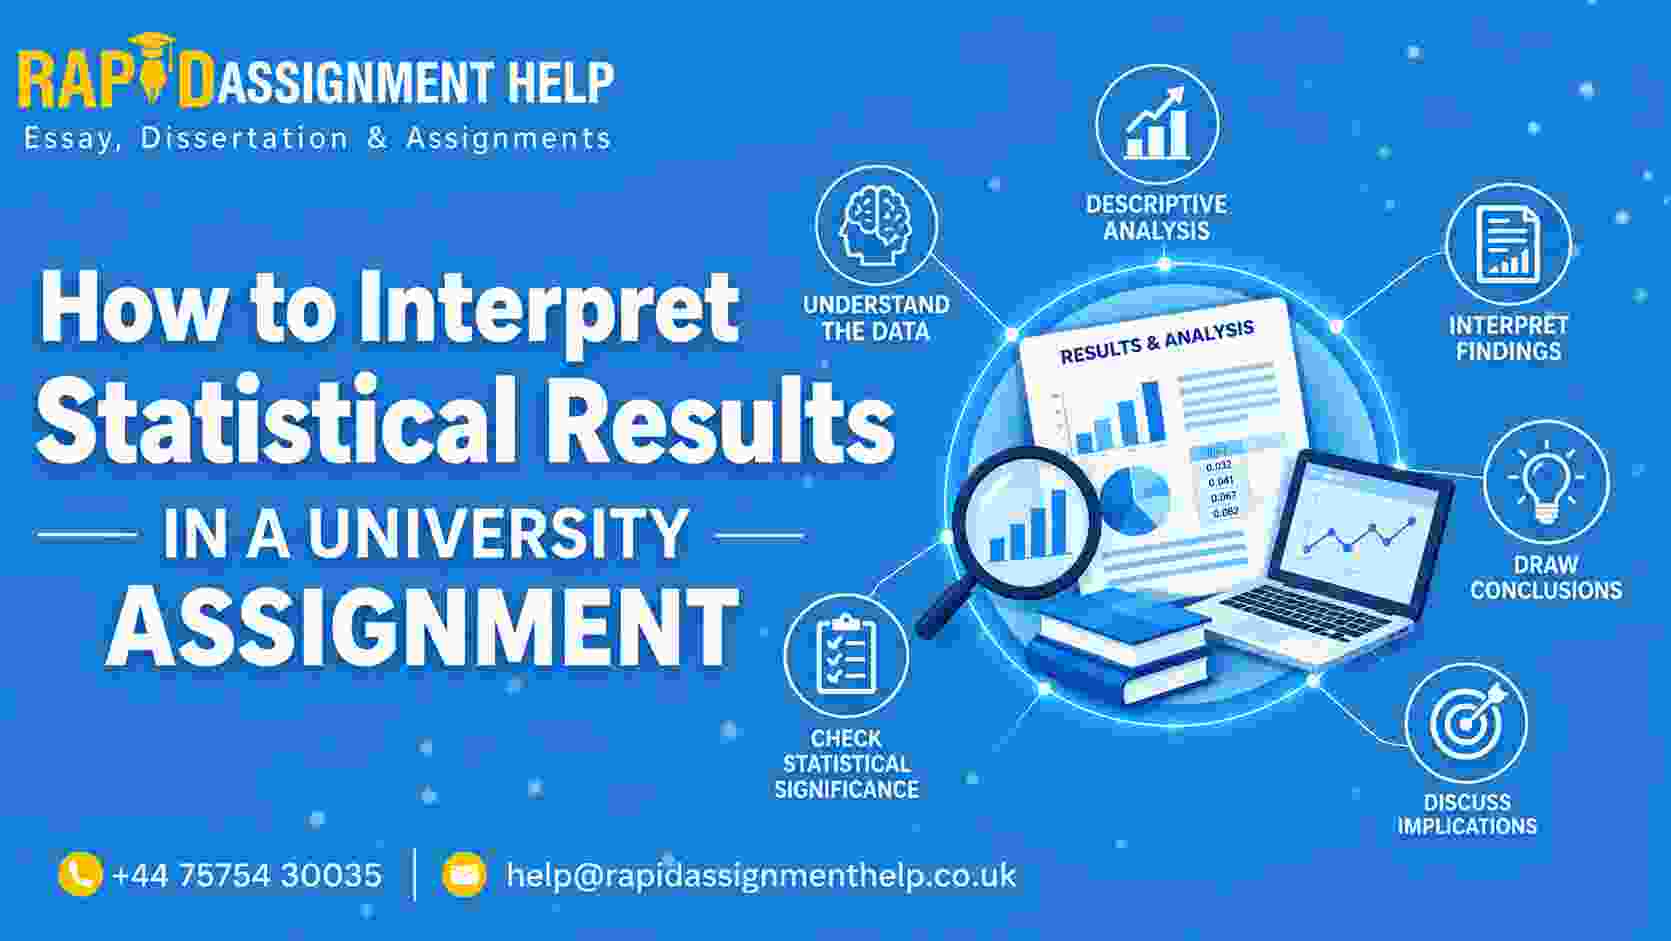
You might have learned a lot at this point but we don’t want to make you feel daunted and provide actionable steps. So here are the 6 ways to interpret the statistical results without getting distracted:
Once you have a positive answer for these questions, you’re good to go. Now it’s time to end this blog with some useful findings.
At this point of the blog, you have everything to succeed in interpretation of statistics assignment. However, what to keep in mind is that the goal is not to fill the paper with numbers. Take a step back and think about what those numbers reveal and start explaining their meaning in the context of your research. That’s where most students lack but not you by following our provided steps and tips
When you move from result to meaning, and from meaning to academic interpretation, that’s when you deliver something valuable. If you’re ready, implement the strategies and ways to excel in your academics. And remember, well-interpreted results are not just about performing statistical analysis but also to show what the findings actually tell you.
I am a PhD holder from the University of Manchester in Statistics. I am an expert in statistics having secured first rank in my final exams. I am also a guest lecturer at many universities in the UK. I have published many research papers and I love helping students to understand their subjects of statistics. Connect with me if you need any help in your statistics assignments.
Get Extra 10% OFF on WhatsApp order!
use discountCopyright 2026 @ Rapid Assignment Help Services